
Main Takeaways:
- The video gaming industry experienced a 1,372% increase in the US between 2000 and 2022.
- From 2000 to 2010, the industry’s worth saw a steady and consistent increase [$6.6 billion vs $18.6 billion].
- In contrast, from 2011 to 2022, the growth rate surged exponentially [$17 billion vs $97.67 billion].
The video game industry in the US has experienced a remarkable and dynamic evolution over the years, reflecting substantial growth and shifts in consumer behavior and technological advancements.
In this post, we’ll explore how the video gaming market size has evolved in the US from 2000 to 2023.
The numbers below reflect the video game sales from 2000 to 2022, along with an estimated figure for 2023.
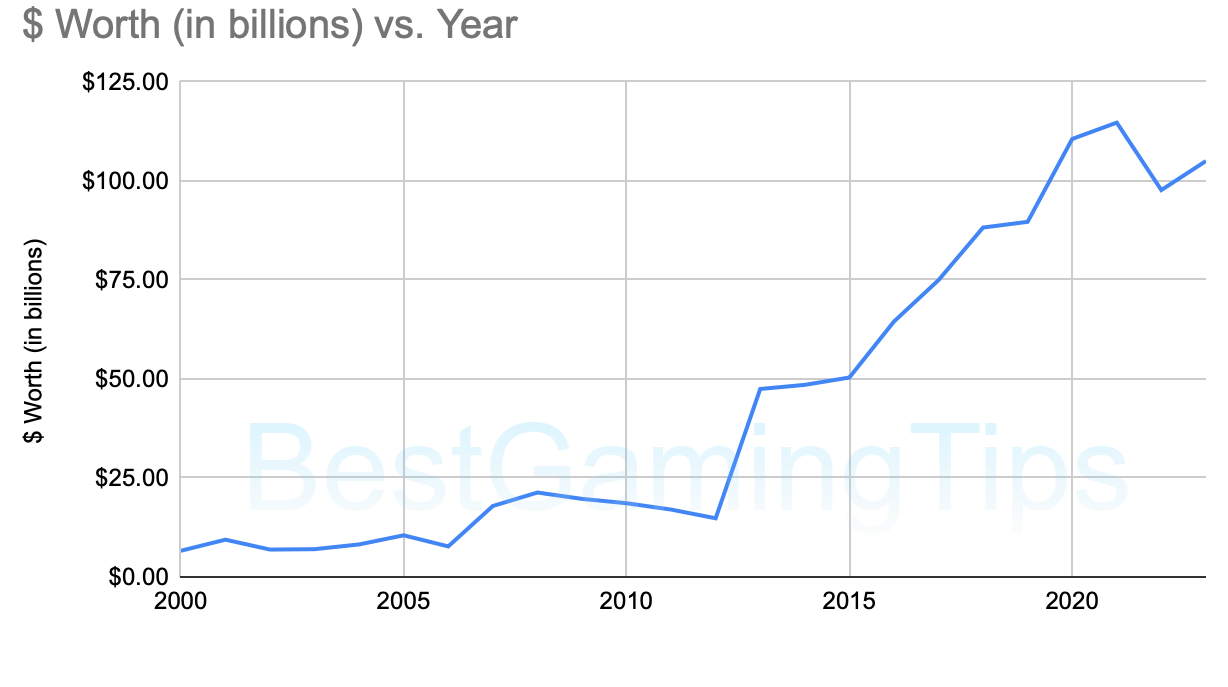
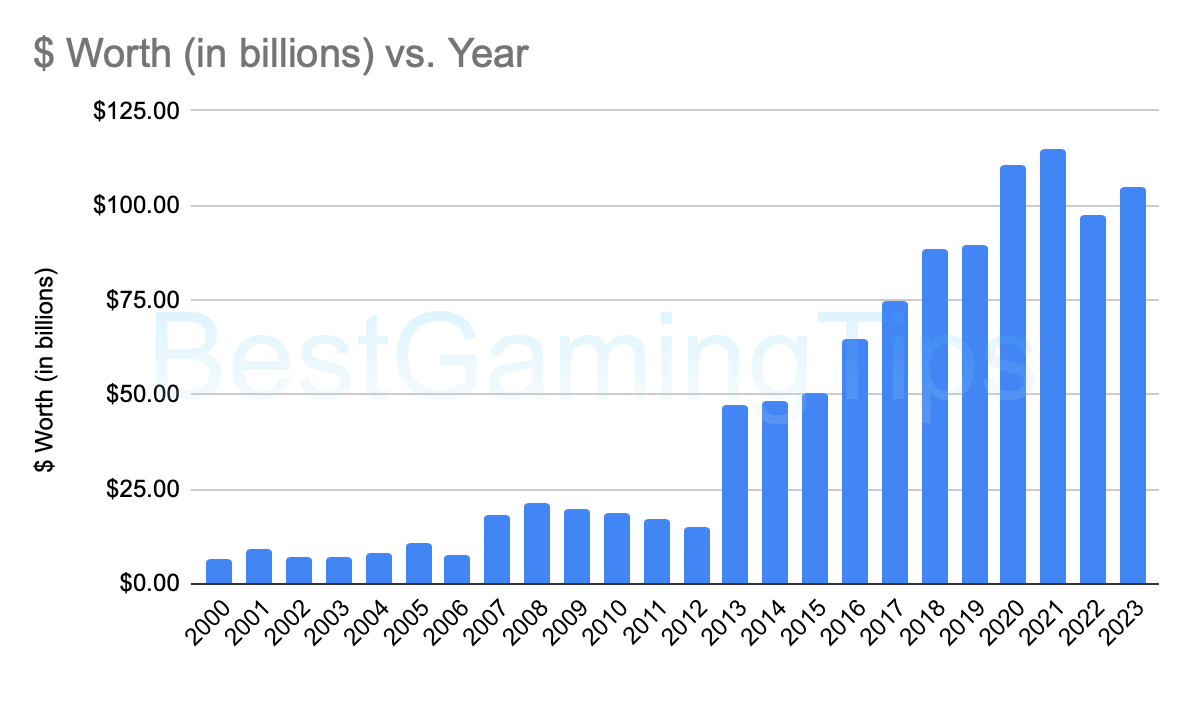
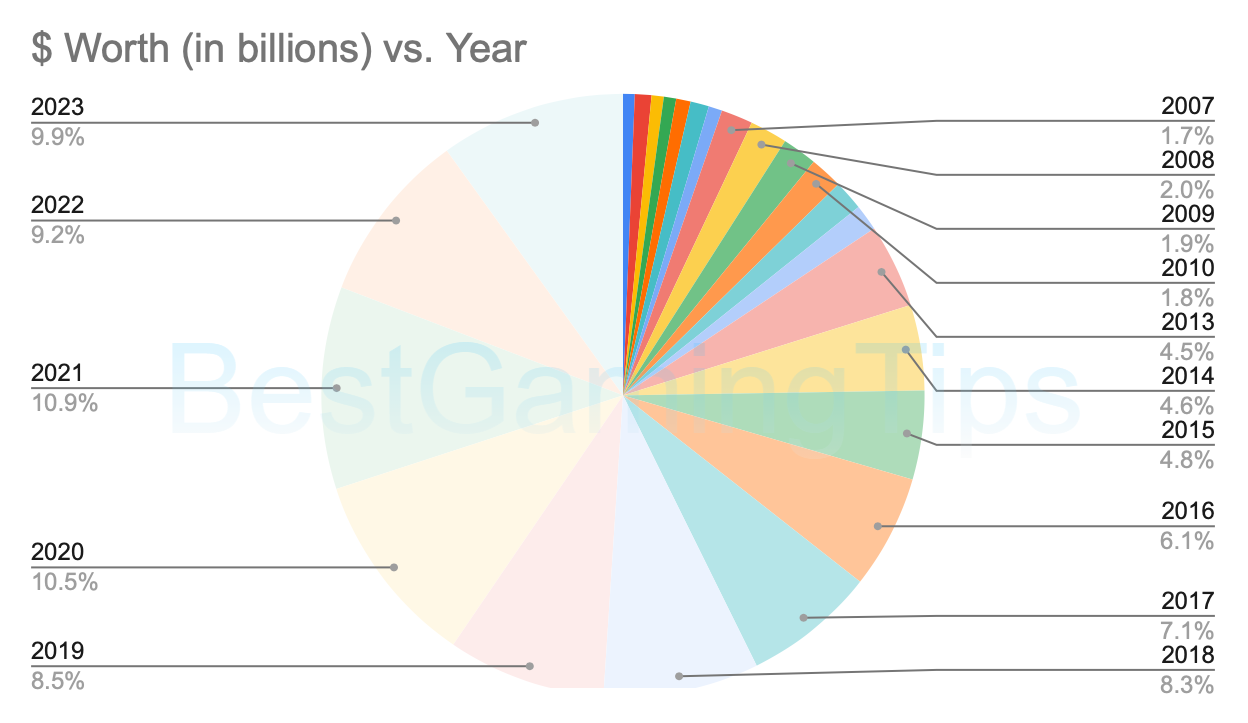
Video Gaming Market Size in The US [2000-2023]
2000 vs 2022: An increase of 1,372%
 The US video gaming industry has seen a dramatic increase in value over the past two decades.
In 2000, the industry was worth just $6.6 billion.
By 2022, that number had grown to $97.67 billion, an increase of over 1,372%.
Early Growth Phase (2000-2005)
During the early 2000s, the video game industry saw steady growth, with its worth increasing from $6.6 billion in 2000 to $10.5 billion in 2005.
This period witnessed the rise of gaming consoles like PlayStation 2, and Xbox, driving sales and capturing a broad audience of gamers.
Fluctuations and Expansions (2006-2011)
Between 2006 and 2011, the video game industry experienced fluctuations in worth, influenced by factors such as the global economic recession.
The worth reached its peak in 2007, skyrocketing to $17.9 billion, likely driven by the success of new gaming consoles and blockbuster titles.
However, in subsequent years, the industry witnessed a slight decline, with sales stabilizing around $17 billion.
Emergence of New Platforms and Digital Distribution (2012-2016)
The period from 2012 to 2016 marked a transformative phase in the industry.
The rise of mobile gaming, coupled with the increasing popularity of digital distribution platforms like Steam, contributed significantly to the worth’s growth.
The industry saw a remarkable surge in worth, reaching $64.47 billion in 2016, driven by the increasing accessibility of games to a wider audience through smartphones and digital storefronts.
Explosive Growth and Record-breaking Revenue (2017-2021)
From 2017 to 2021, the US video game industry witnessed explosive growth, breaking records year after year.
The worth climbed from $74.93 billion in 2017 to $114.7 billion in 2021, fueled by the introduction of powerful gaming consoles (e.g., PlayStation 4, Xbox One) and a plethora of critically acclaimed and commercially successful titles.
Additionally, the rise of in-game purchases and microtransactions in online multiplayer games further boosted revenue.
Impact of the Pandemic and Future Projections (2020-2023)
The COVID-19 pandemic, which led to increased indoor activities, further accelerated the demand for video games in 2020.
The worth reached $110.58 billion, showcasing the industry’s resilience and adaptability in challenging times.
While 2021 saw a continued rise, with the worth reaching $114.7 billion, the estimated worth for 2023 stands at $105 billion.
The projected decrease in worth can be attributed to the normalization of post-pandemic conditions.
US Video Gaming Growth: 2000 to 2010 vs 2011 to 2022
From 2000 to 2010
Steady Growth
The video gaming industry witnessed steady growth from 2000 to 2010, with its worth increasing from $6.6 billion in 2000 to $18.6 billion in 2010.
This growth was fueled by the rise of gaming consoles like PlayStation 2, Xbox 360, and Wii, attracting a broad audience of gamers.
From 2011 to 2022
Explosive Growth
The video gaming industry experienced explosive growth from 2011 to 2022, witnessing a surge from $18.6 billion in 2011 to $97.67 billion in 2022.
This growth was driven by technological advancements, digital distribution, and the rise of mobile gaming.
The video gaming industry’s worth grew substantially in both periods, but the growth rate from 2011 to 2022 significantly outpaced the growth from 2000 to 2010.
The years from 2011 to 2022 experienced a more rapid evolution, driven by technological innovations, the widespread adoption of mobile gaming, and the expansion of digital distribution.
Additionally, the industry saw a surge in esports and streaming, transforming gaming into a global entertainment phenomenon.
Factors That Have Contributed to the Growth of the Video Gaming Industry
Technological Advancements
Advancements in technology have been a driving force behind the industry’s growth.
More powerful gaming consoles, high-performance PCs, and mobile devices have enabled the development of visually stunning and immersive gaming experiences.
Players can’t help but buy new games.
AAA Titles
The increasing worth of the industry can be attributed, in part, to the continued success of AAA (Triple-A) titles.
AAA games contribute significantly to overall sales and drive demand for gaming consoles and hardware.
The success of blockbuster gaming franchises like Call of Duty, Fortnite, League of Legends, and Minecraft has attracted massive audiences and driven substantial revenue for the industry.
The Free-to-Play Model
The free-to-play model, supported by in-game purchases and microtransactions, has become prevalent in many games.
This model allows players to access games at no cost and pay for additional content or cosmetic items, making gaming more accessible and profitable for developers.
In-game purchases and microtransactions have become a substantial source of revenue for the industry, especially in online multiplayer and free-to-play games.
These additional revenue streams have contributed to the industry’s continued growth in recent years.
Digital Distribution
The rise of digital distribution platforms, such as Steam, PlayStation Network, and Xbox Live, has revolutionized how games are distributed and accessed.
Digital storefronts have made it easier for developers to reach a wider audience, while gamers enjoy the convenience of downloading games instantly.
Mobile Gaming
The popularity of smartphones and tablets has led to the rise of mobile gaming.
Mobile games are easily accessible, often free-to-play with in-app purchases, making them appealing to a broad demographic of gamers.
Online Connectivity
The widespread availability of high-speed internet has facilitated online gaming and multiplayer experiences.
Gamers can now connect and compete with players from all around the world, fostering a vibrant and engaged gaming community.
Gaming communities and social interaction platforms have brought players together, fostering a sense of belonging and camaraderie among gamers.
Cultural Acceptance
Gaming has become more socially accepted and mainstream, appealing to a broader range of people across various age groups and backgrounds.
US Video Gaming Industry Evolution [2000-2023]
2000: $6.6 billion
2001: $9.4 billion
2002: $6.9 billion
2003: $7 billion
2004: $8.2 billion
2005: $10.5 billion
2006: $7.7 billion
2007: $ 17.9 billion
2008: $ 21.3 billion
2009: $19.7 billion
2010: $18.6 billion
2011: $17 billion
2012: $14.8 billion
2013: $47.45 billion
2014: $48.49 billion
2015: $50.34 billion
2016: $64.47 billion
2017: $74.93 billion
2018: $88.21 billion
2019: $89.65 billion
2020: $110.58 billion
2021: $114.7 billion
2022: $97.67 billion
2023: $105 billion (estimated)
Note:
It is essential to acknowledge that the data is not precise due to the lack of public disclosure by several prominent digital distribution platforms regarding their sales figures.
For instance, Valve, the company behind Steam, does not publicly reveal its annual revenue from the platform.